Updated November 2025
Australia’s payment habits are changing quickly. Cash use continues to fall, and mobile wallets are now one of the most common ways to pay. Real time payments through PayID and the NPP are becoming more common, especially for transfers between people and small businesses.
In this 2025 guide, we look at the latest Australian payment statistics, covering cash, cards, digital wallets, BNPL, PayID, and e-commerce.
TL;DR - How are Australians paying in 2025?
Cash use in Australia has dropped to less than 10 per cent of payments, though it remains important for older and regional communities. Cards continue to dominate both in-person and online spending, supported by contactless technology and strong merchant acceptance.
Buy Now Pay Later has become mainstream, with around one in three Australians using it, and from June 2025 it is formally regulated as credit under the National Consumer Credit Protection Act. Real-time payments through the New Payments Platform are expanding rapidly, with more than 27 million PayID registrations and growing business adoption of PayTo.
E-commerce keeps rising, with cards leading online transactions and PayID emerging as a lower-cost alternative. Australia is now firmly moving toward a digital-first payment environment built on speed, convenience, and regulatory reform.
Guide
Looking for a payment partner to help you set up custom payment workflows? Get in touch to learn more about how we can help you!
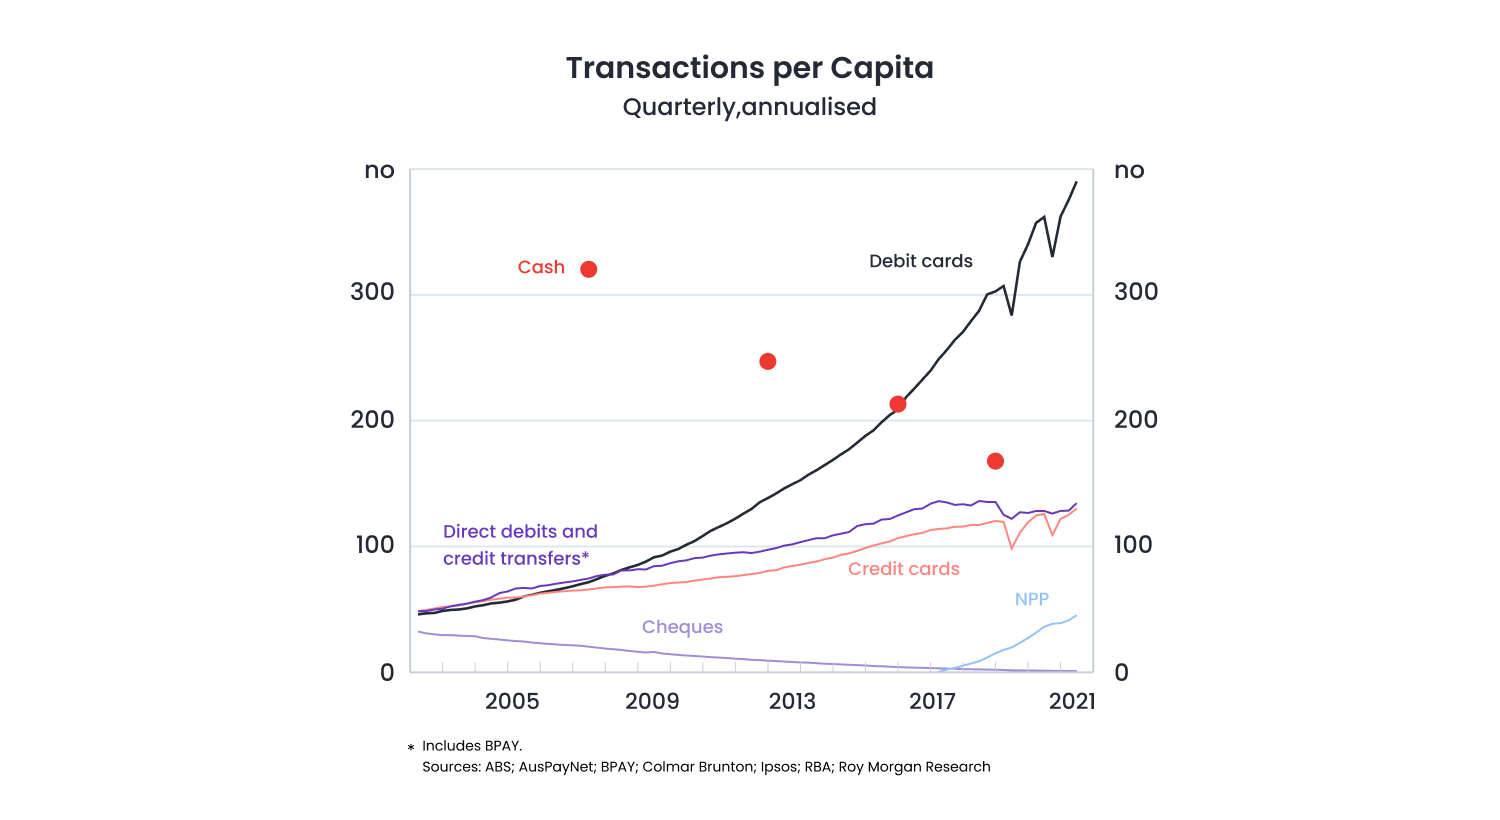
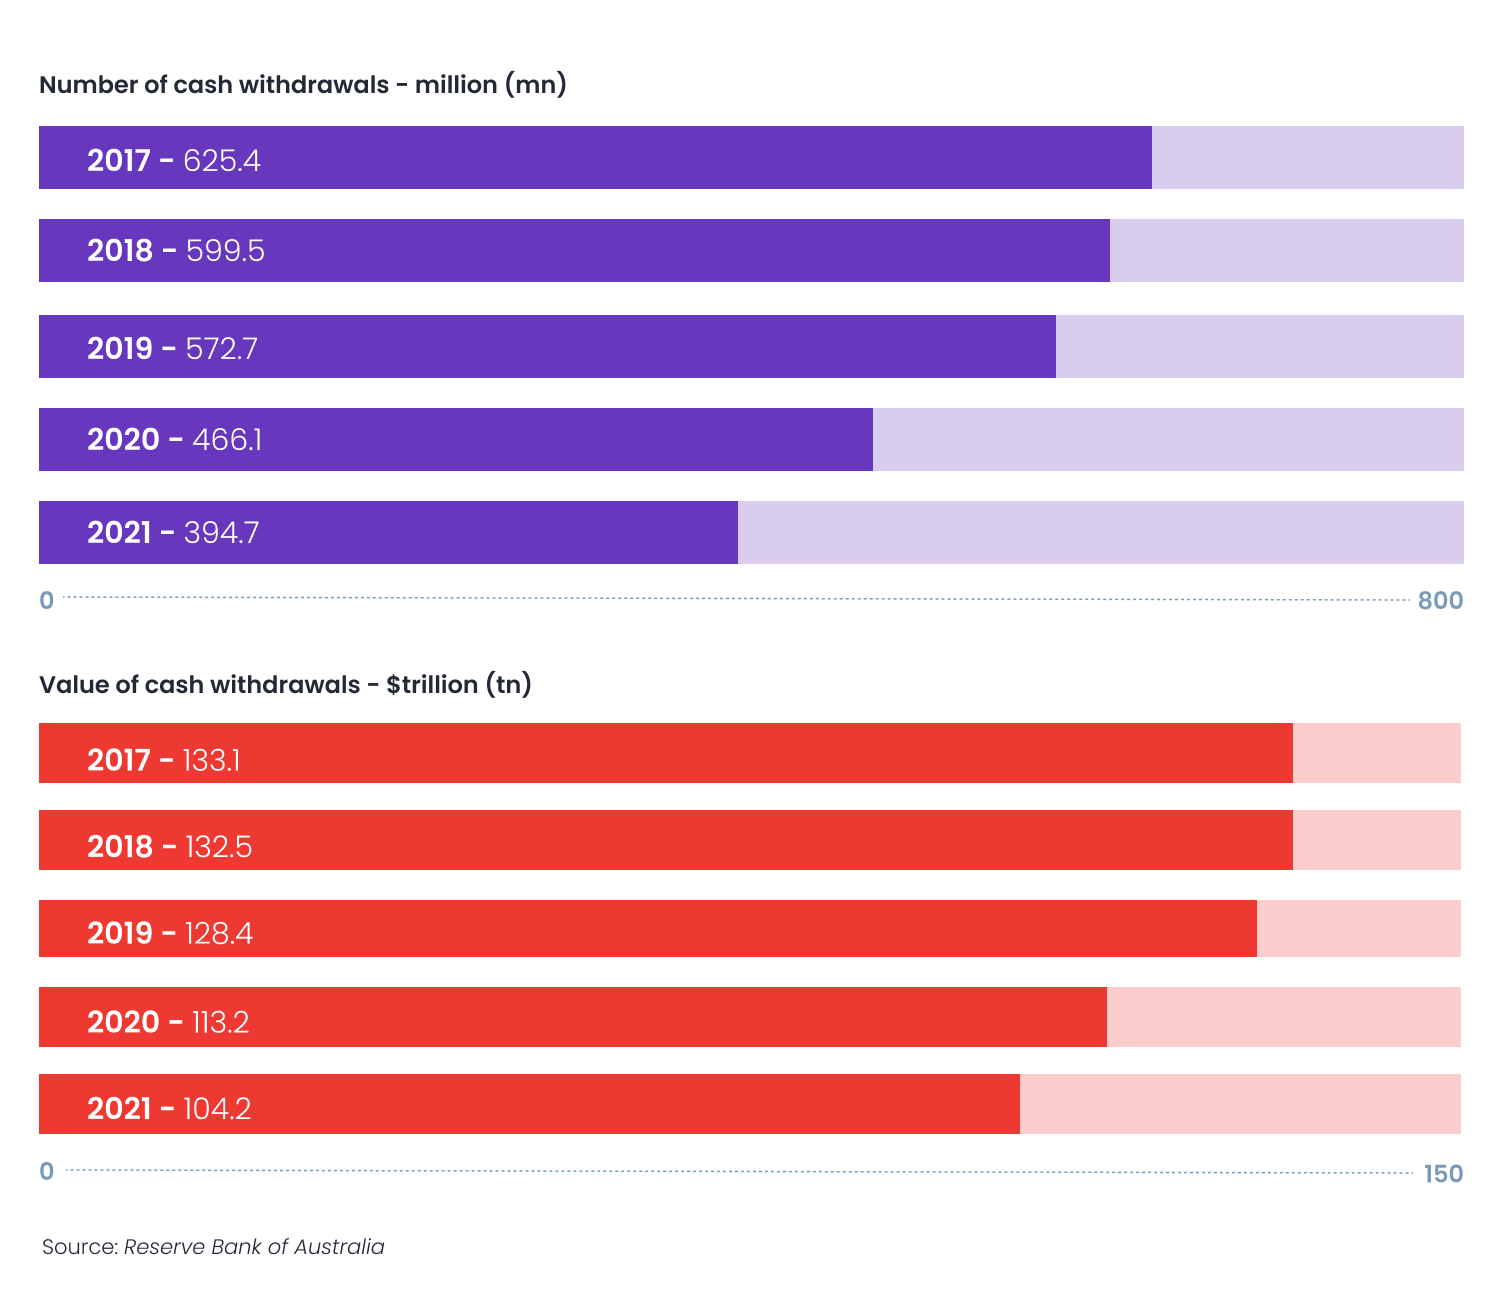
Is Cash Still Used in Australia in 2025?
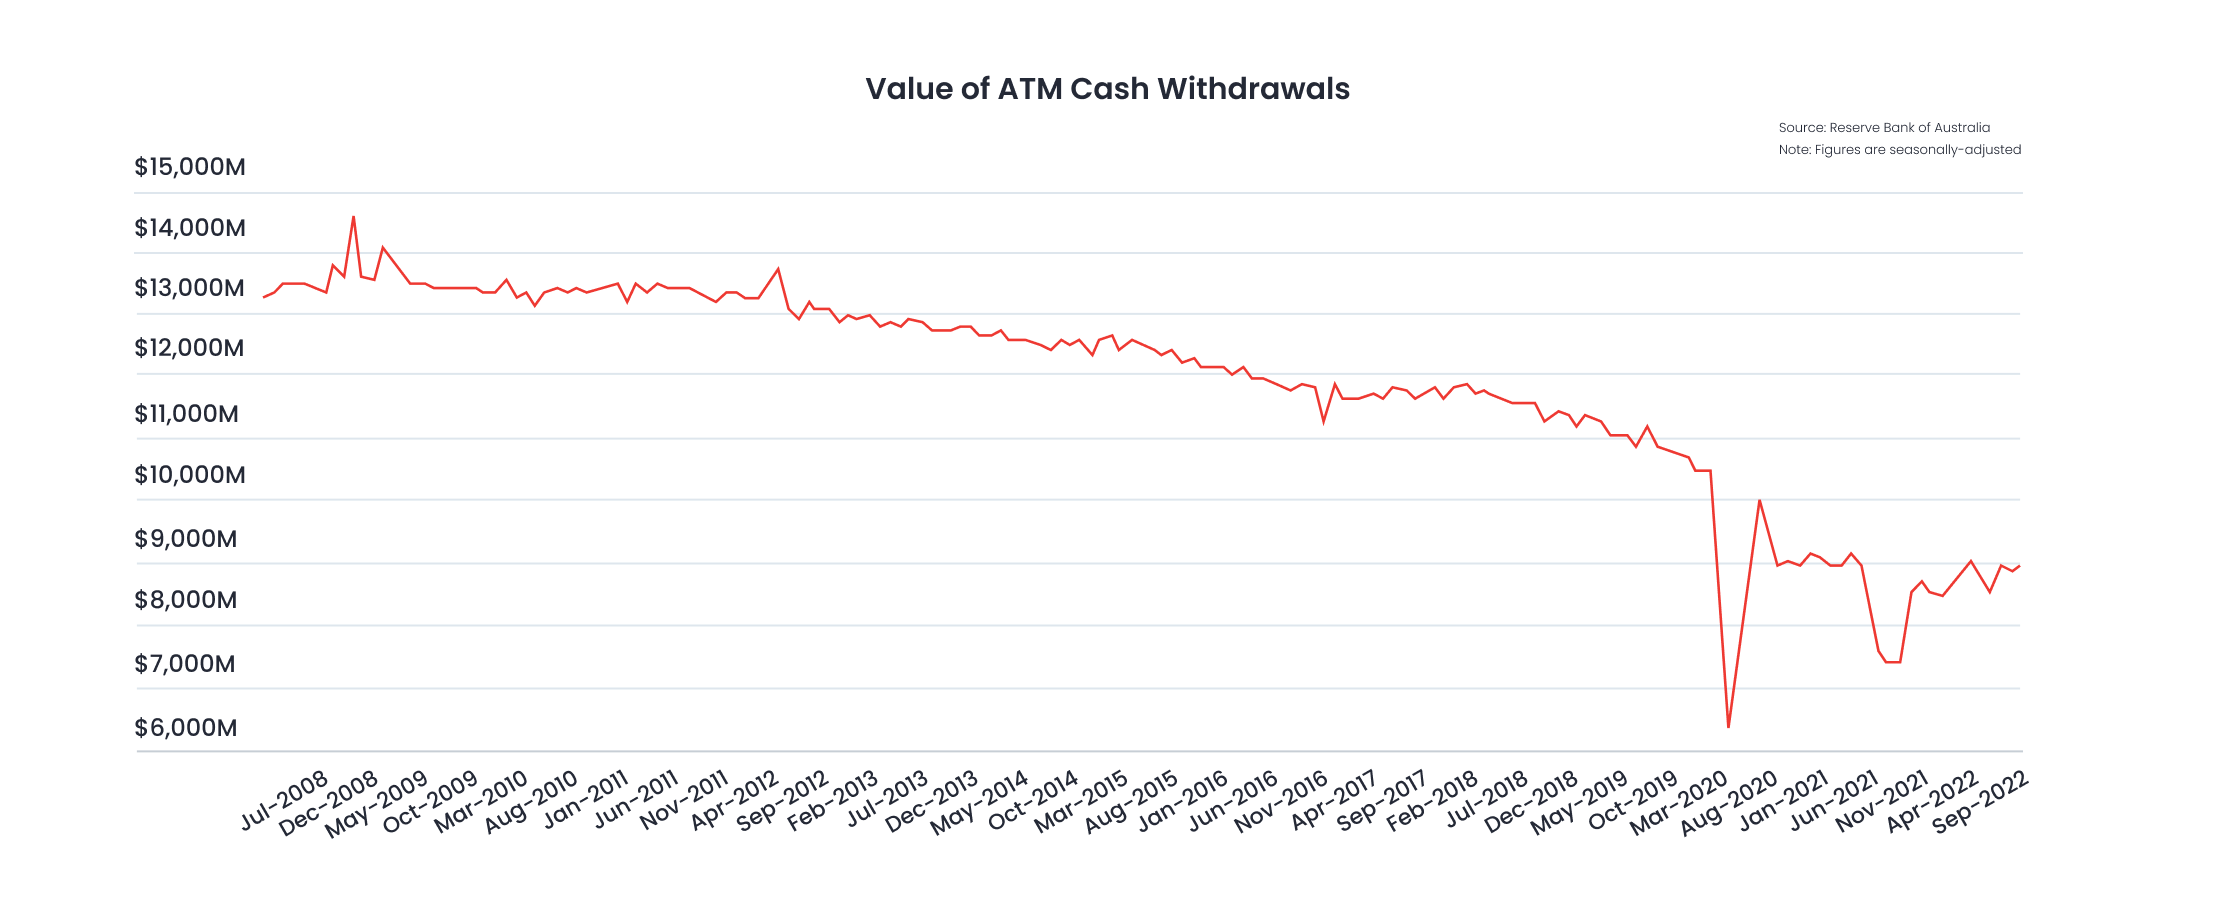
Cash use in Australia has fallen sharply over the past two decades. In 2007, around 69% of consumer payments were made with notes and coins. By 2022, that figure had dropped to about 13% of payments by number, and roughly 8 % by value.
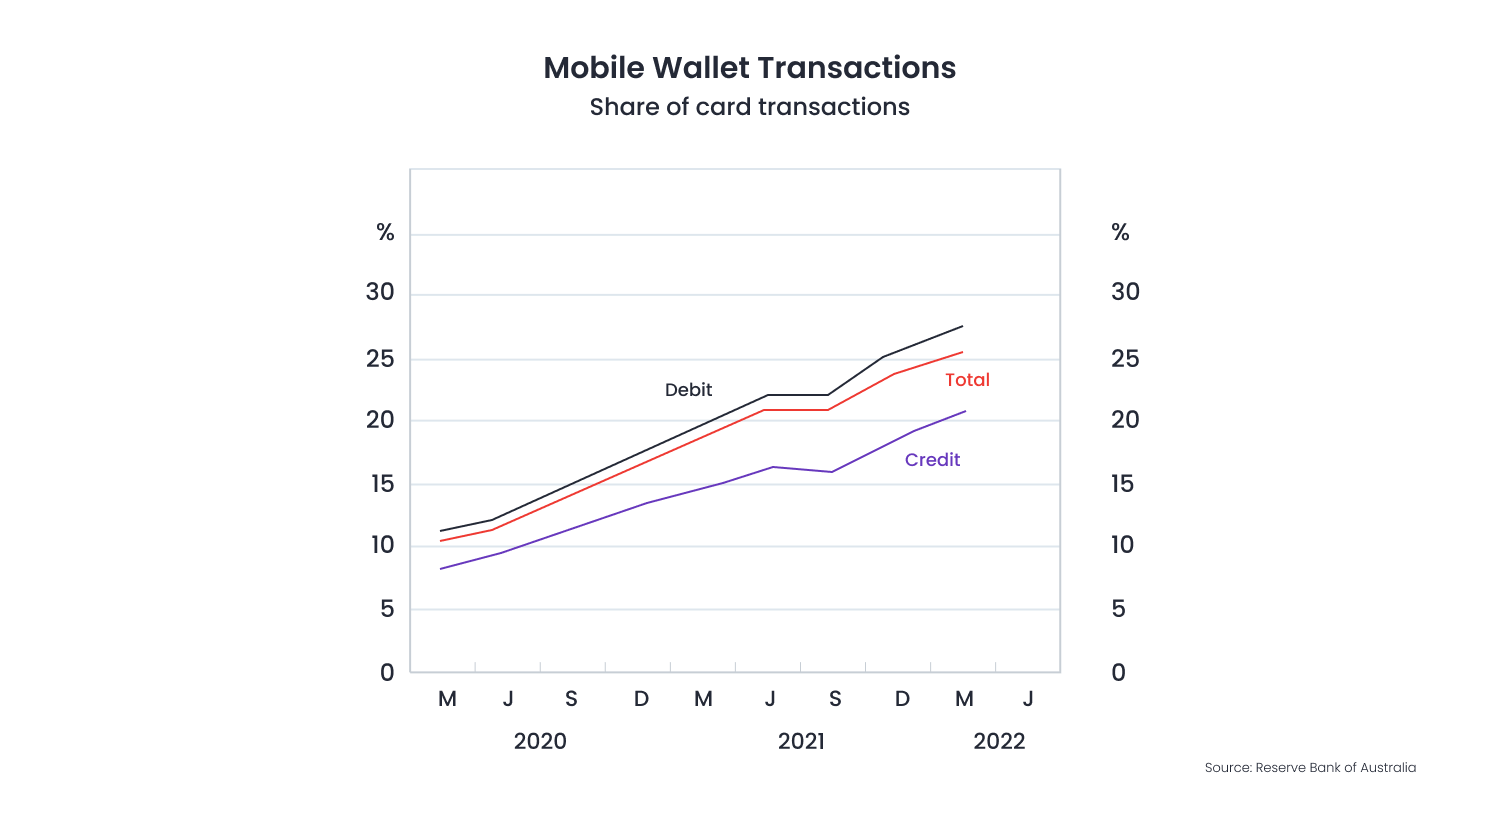
More recent RBA analysis notes that while cash use continues to decline, demand for access to cash has, stabilised since 2022, suggesting it is still important for some groups, including older Australians and people in regional areas. At the same time, digital wallets and contactless payments are surging. By late 2024, mobile wallets accounted for about 44 per cent of in-person transactions, and Australians made over 500 million mobile wallet payments in a single month, worth more than AUD 20 billion.
For many people, cash is no longer central to daily spending, though it remains part of the payment mix. It is now often reserved for small purchases, privacy, or specific situations rather than used only for emergencies.
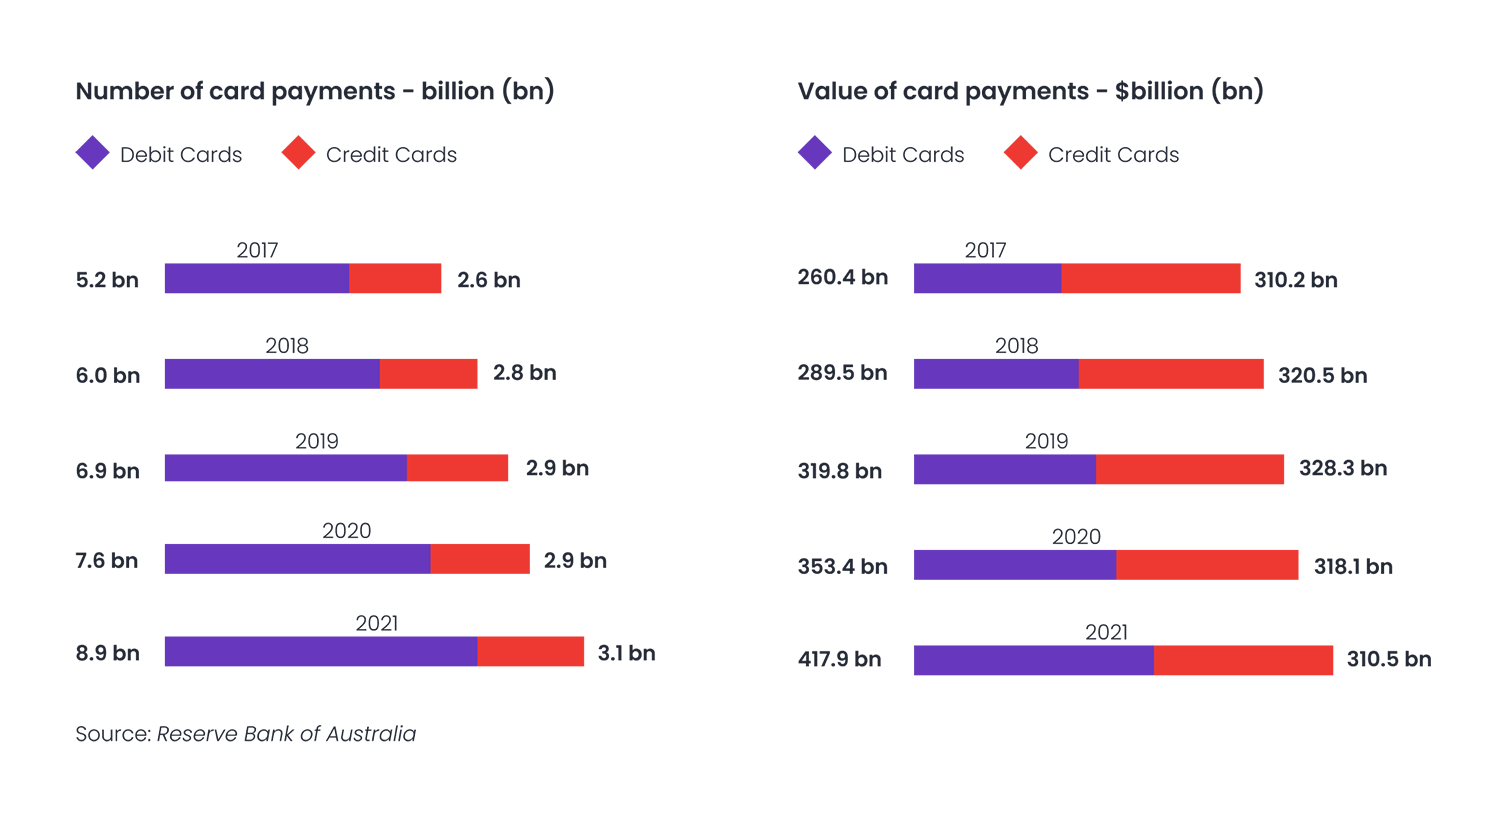
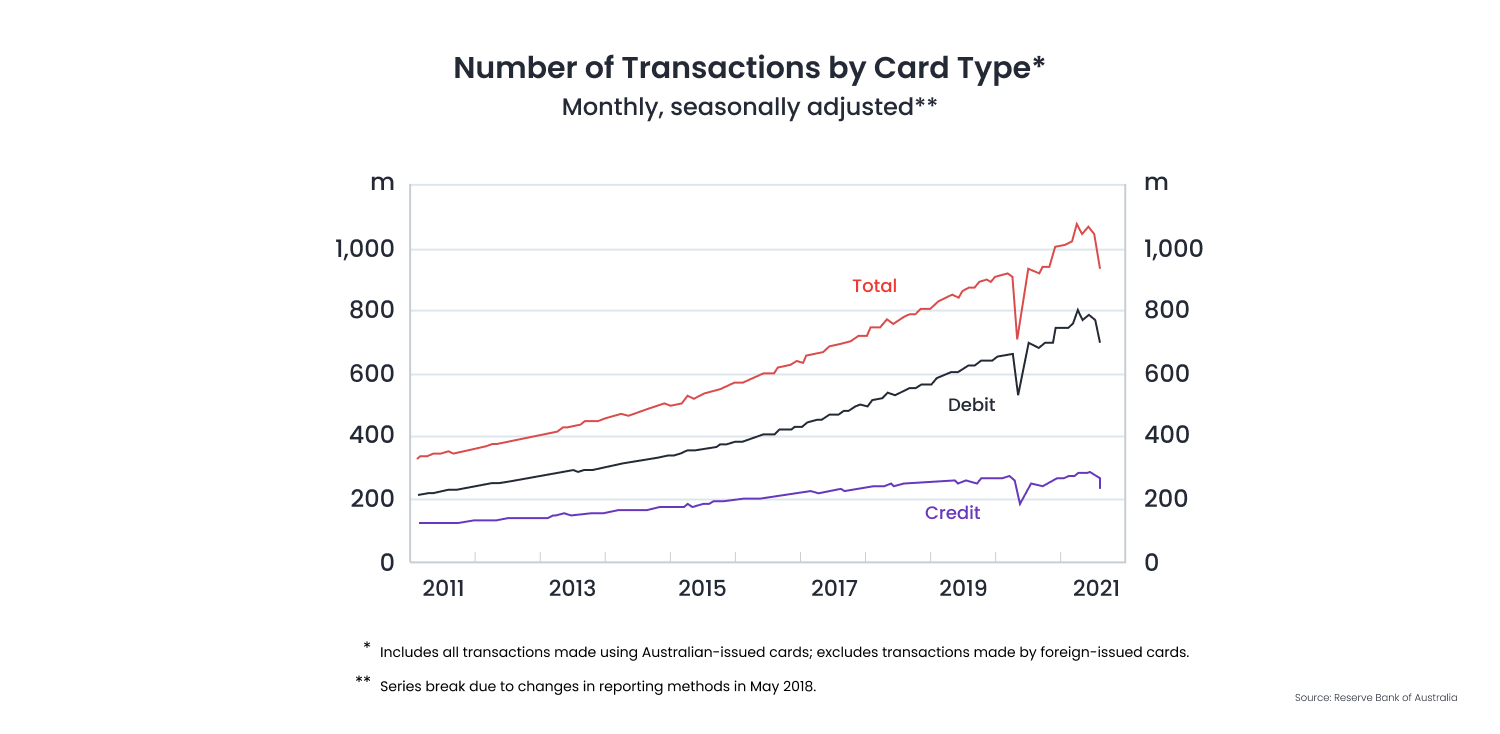
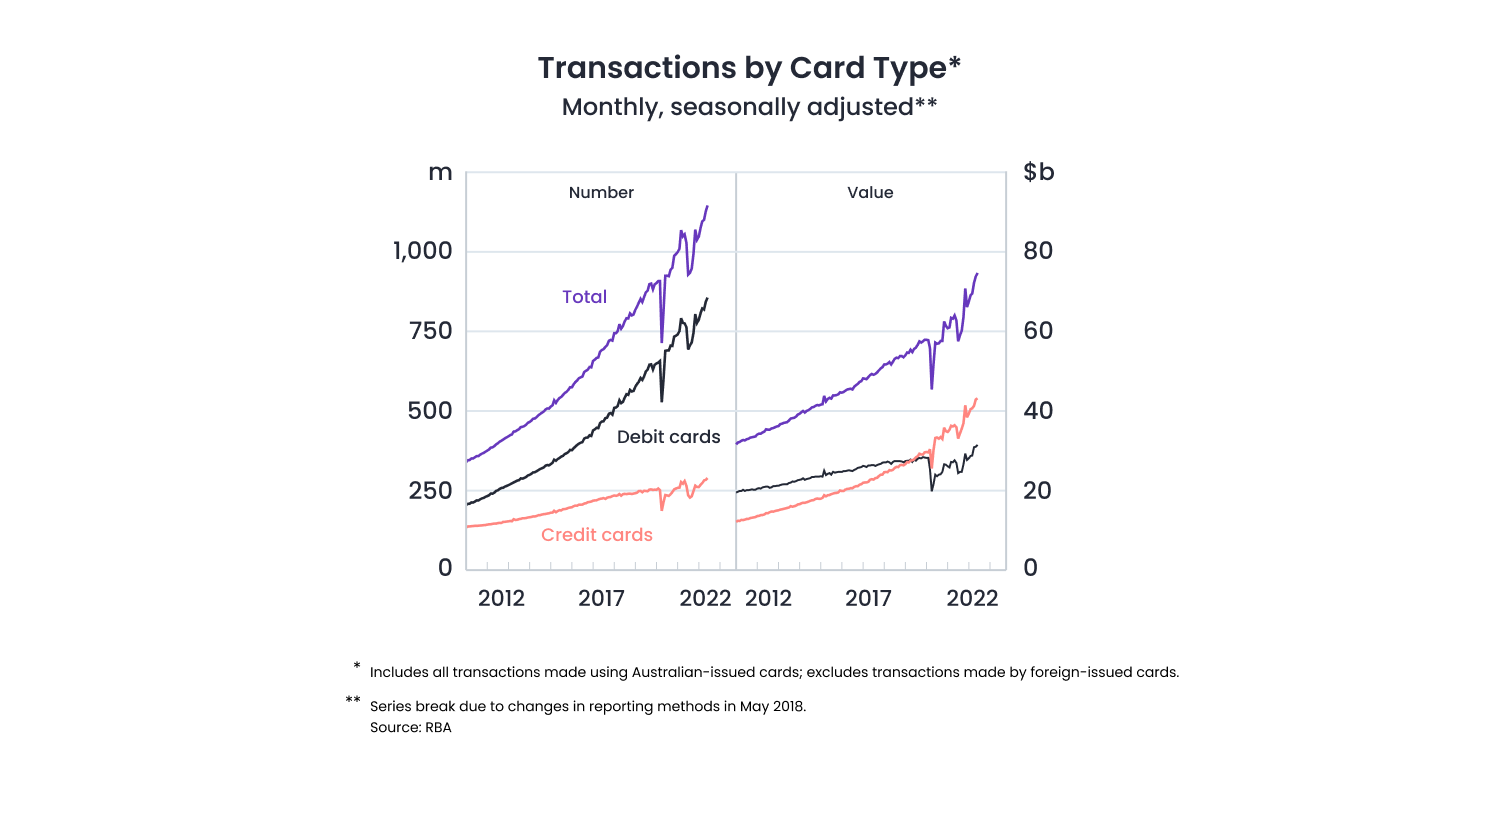
Do Australians Still Prefer to Pay with Cards?
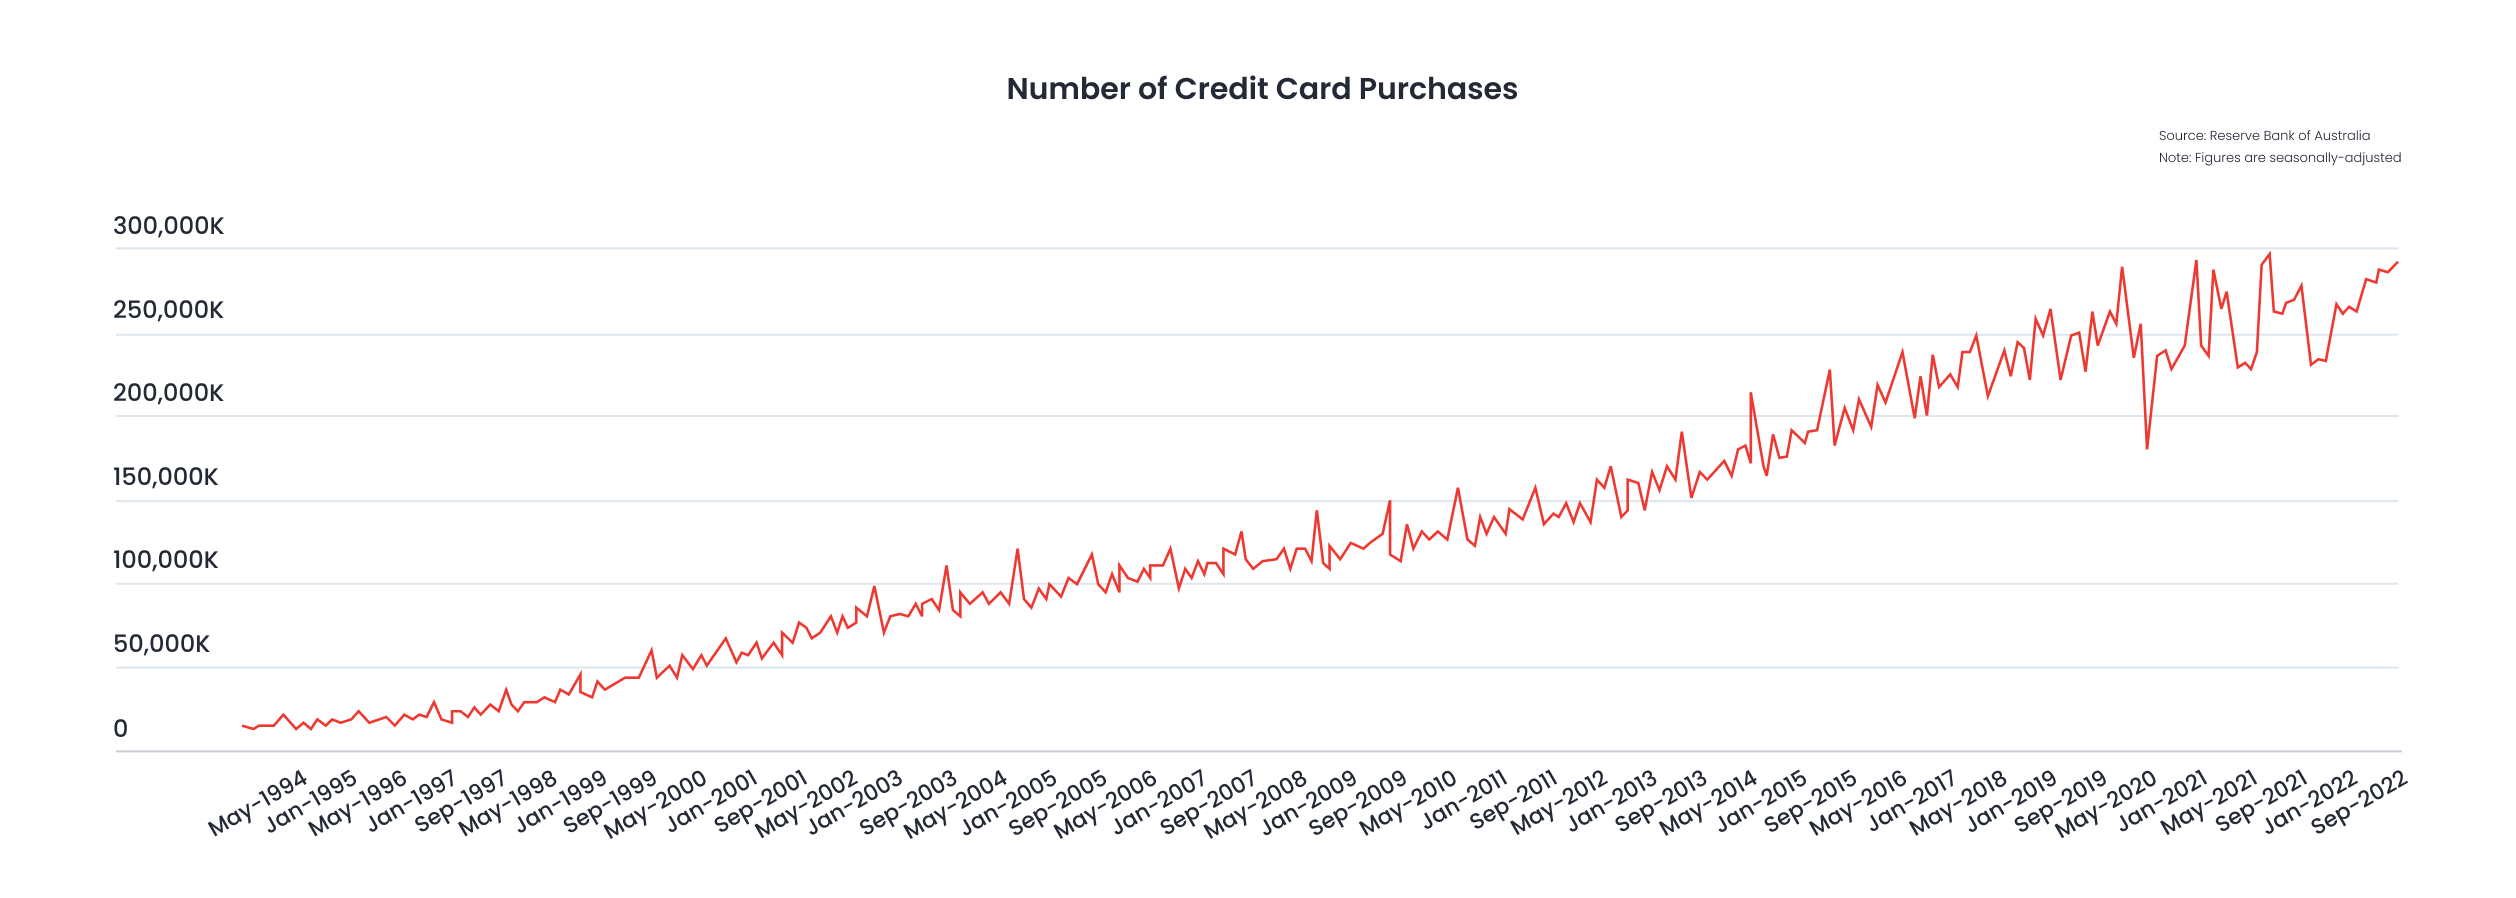
Cards remain the most common way to pay in Australia, and the shift toward contactless payments continues to accelerate. The most recent Reserve Bank of Australia Consumer Payments Survey (2022) found that cards were used for about three quarters of all consumer payments. When contactless cards and mobile wallets are included, in-person card payments made up around 98 per cent of transactions.
Newer figures from other industry sources show that this trend has continued and strengthened. In 2024, Australians made more than 500 million mobile wallet payments in a single month, worth over AUD 20 billion, and the total annual value of mobile wallet transactions reached about AUD 126 billion, almost doubling year on year (Australian Banking Association, 2024). Industry forecasts released in 2025 project that digital wallet transaction values could exceed AUD 200 billion by the end of the year, representing more than 20 per cent growth from 2024 (GlobalData via Australian FinTech, 2025).
The Reserve Bank of Australia is also consulting on proposed changes to interchange fee caps and card payment regulation. Under the preferred option in its July 2025 consultation paper, the domestic credit card interchange cap could be reduced from 0.8 per cent to 0.3 per cent, and benchmarks for debit and prepaid cards may also be lowered. These proposed reforms aim to reduce merchant costs and promote greater use of lower-cost payment methods such as PayID and the New Payments Platform (RBA Consultation Paper, 2025). The RBA has invited industry feedback and indicated that any changes would likely take effect in 2026 (Allens Legal Insight, 2025).
Cards continue to dominate everyday spending in Australia, supported by their ease of use and near-universal acceptance.
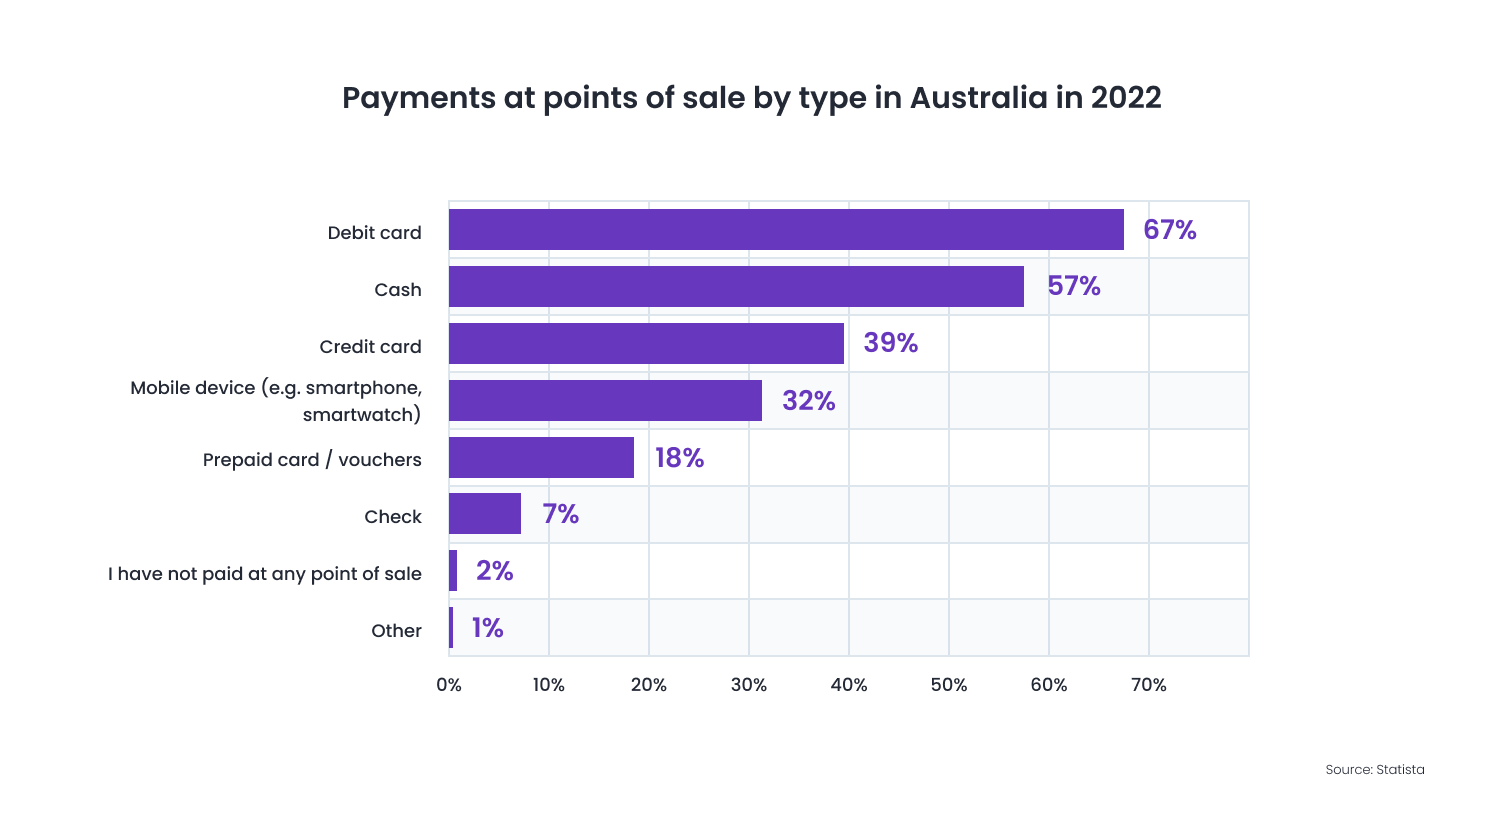
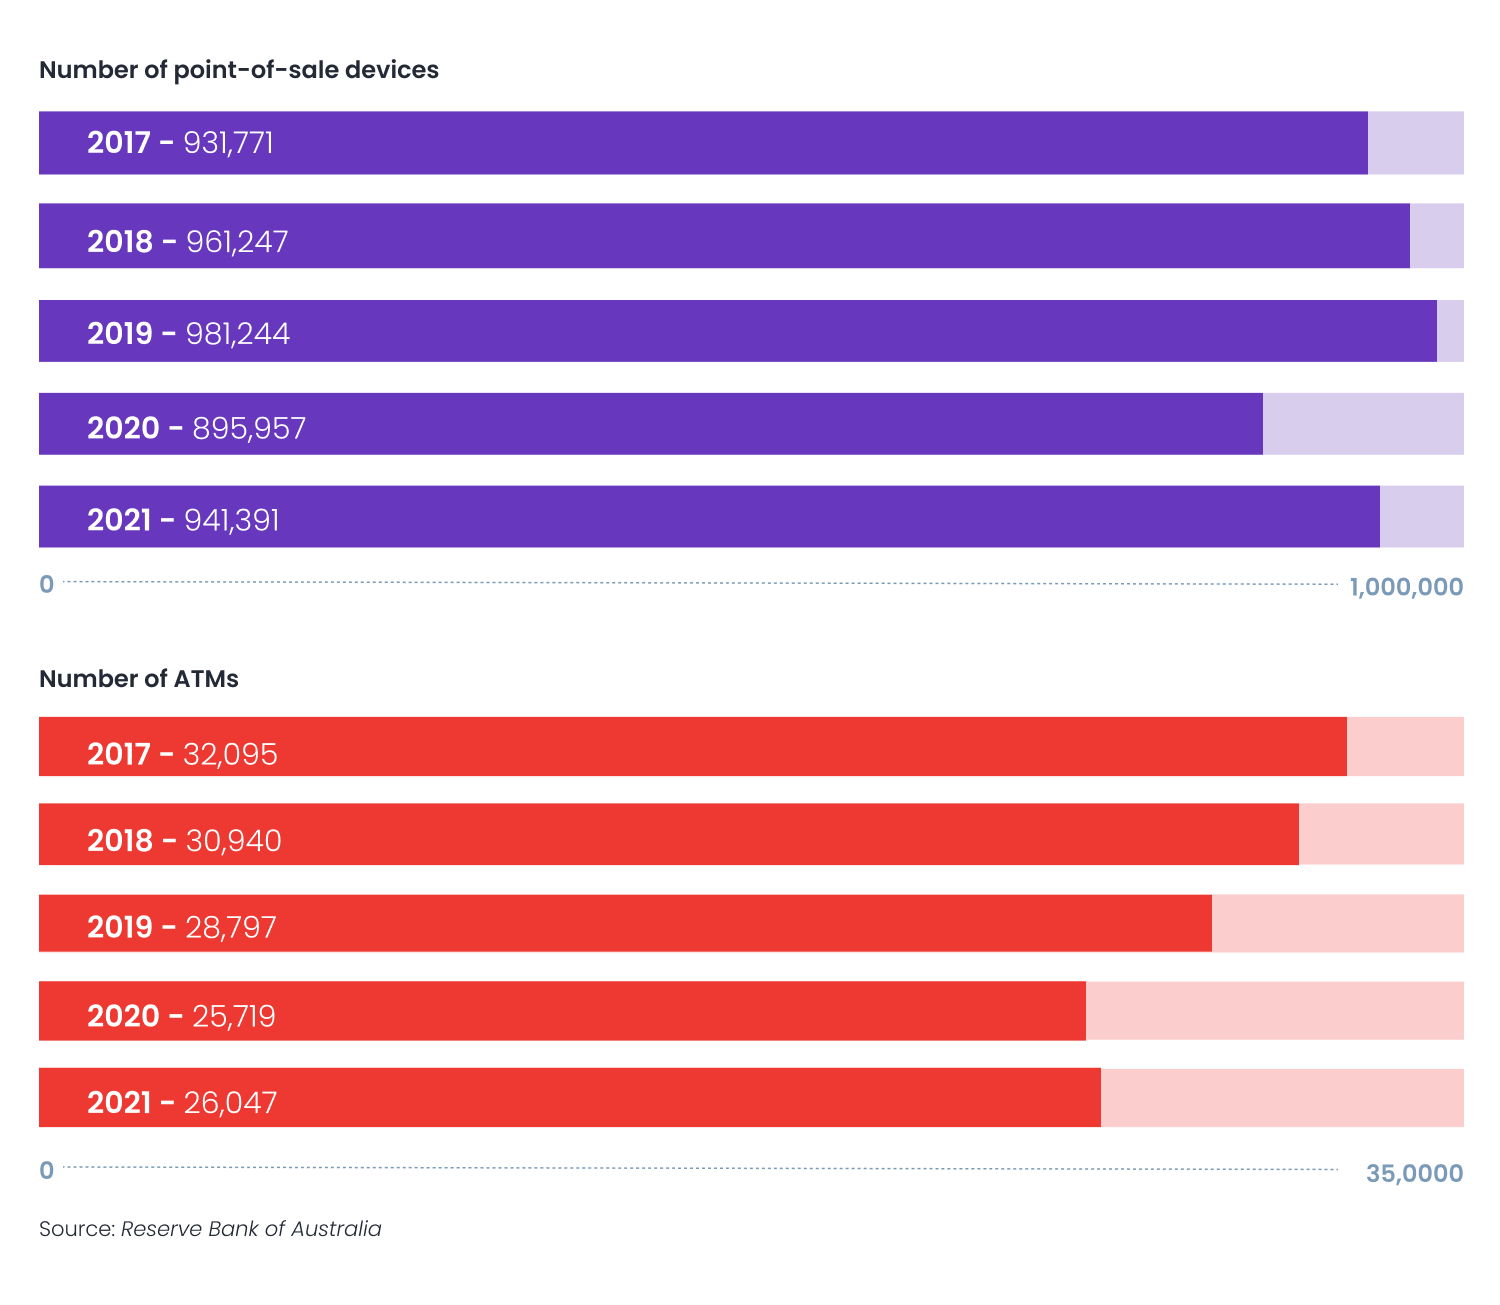
How Are Point of Sale Payments Changing in Australia?
Point of sale payments in Australia are changing quickly as technology, convenience and customer habits reshape how people pay in stores, restaurants and cafés. Traditional checkout counters are being replaced by integrated, cloud-based systems that combine ordering, inventory and payments. Customers are no longer limited to a single register, with many retailers and venues now accepting payments anywhere in-store or at the table.
The Reserve Bank of Australia Consumer Payments Survey (2022) found that cards made up about 75 per cent of consumer payments, and almost all in-person transactions were contactless. Since then, in-person payment habits have continued to evolve. According to the Australian Banking Association, Australians made more than 500 million in-person transactions in October 2024 using tap to pay methods, worth over AUD 20 billion. Total annual card payment value reached around AUD 126 billion in 2024, surpassing ATM withdrawals for the first time.
At the same time, new point of sale technologies are changing how Australians interact with businesses. Many cafés and restaurants now use QR code ordering and payment, allowing customers to browse menus, order and pay from their table. Adoption of these systems has grown steadily since 2020, with research suggesting that more than 60 per cent of casual dining venues now offer QR payments as part of their service model (Hospitality Magazine, 2024). In retail, mobile point of sale devices and self-checkout kiosks are becoming more common, giving customers greater flexibility and faster service.
In 2025, analysts expect the number of venues using integrated point of sale platforms to keep growing as more merchants connect payments, loyalty and ordering systems within a single interface (RetailBiz, 2025). This shift is likely to improve operational efficiency for businesses while providing customers with greater control and convenience at checkout.
Across both retail and hospitality, Australians are prioritising speed, simplicity and autonomy at the counter. While physical cards remain the main way people pay, the rapid evolution of point of sale systems shows that where payments happen is changing just as much as how they are made.
Will BNPL Really Be Treated as Credit in Australia Now?
Buy Now Pay Later (BNPL) has reshaped how Australians shop, but it now operates under formal credit regulation. From 10 June 2025, BNPL providers became subject to the National Consumer Credit Protection Act, meaning they must hold an Australian Credit Licence and comply with responsible lending obligations. This change brings BNPL into line with traditional credit providers, following years of debate over consumer risk and financial oversight (ASIC, 2025).
According to the Australian Finance Industry Association, the main BNPL providers bound by the BNPL Code of Practice had around 5.2 million active accounts in mid-2023. Despite slight declines in user numbers, overall transaction value continued to grow, reaching about AUD 20 billion that year. A KPMG analysis found that Australians’ use of BNPL remains widespread, particularly among younger consumers and those making online purchases under AUD 500.
Under the new regime, providers such as Afterpay, Zip and Humm are required to conduct credit checks and ensure customers can afford repayments before approving transactions. ASIC has released new regulatory guidance and will oversee compliance with licence conditions (ASIC, 2025).
BNPL remains an important part of Australia’s payments landscape, but it now sits within a clearer legal framework designed to balance innovation with consumer protection.
Are Australians Adopting Real-Time Payments Yet?
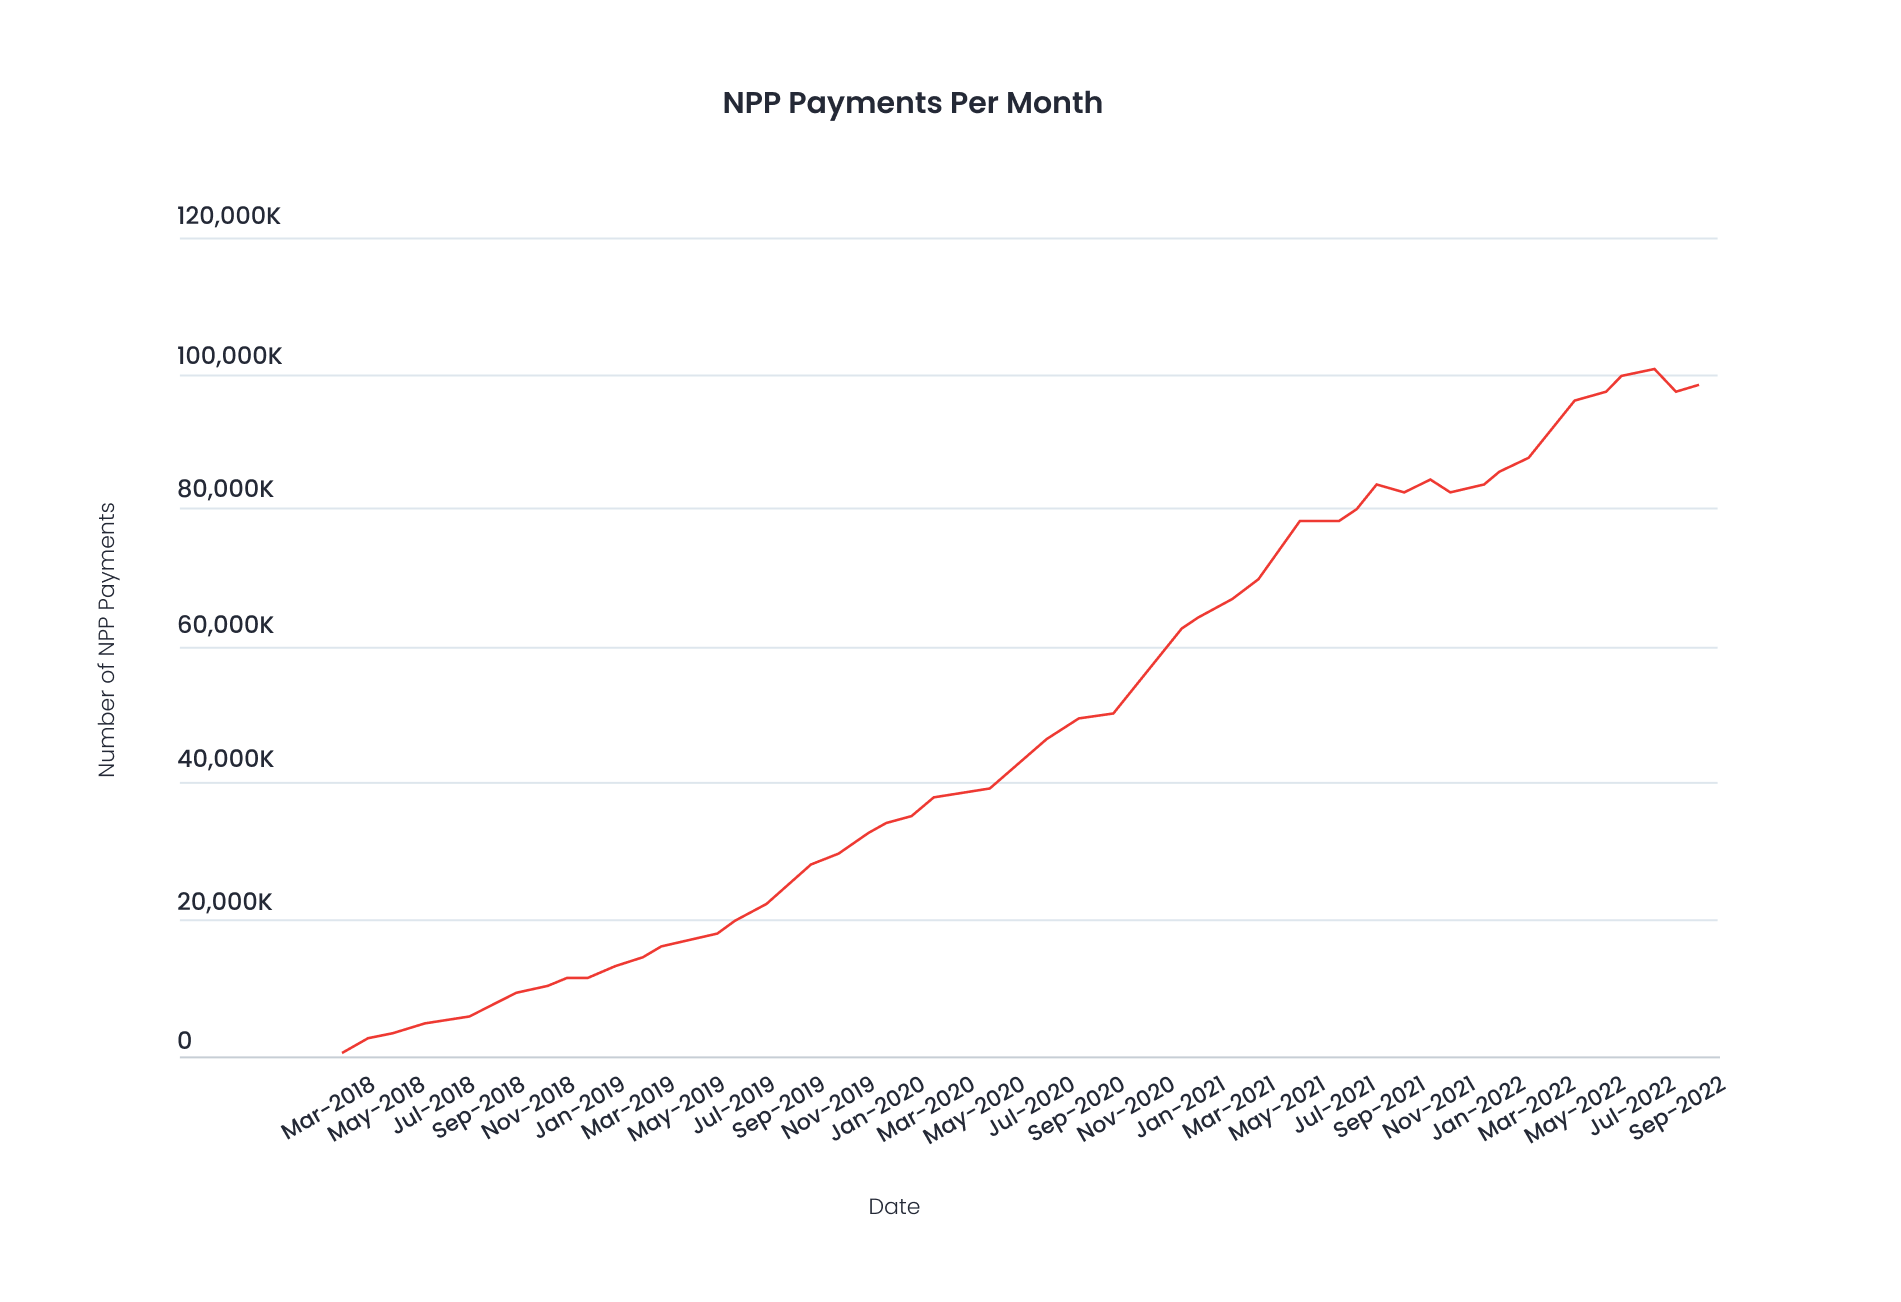
Real time payments through PayID and the New Payments Platform (NPP) are becoming a central part of how Australians move money between accounts. In 2024, the NPP processed about 1.6 billion transactions worth around AUD 1.99 trillion (AusPayPlus, 2025). By late 2024, more than 114 million accounts were enabled to send or receive payments using the NPP framework (AusPayPlus, 2025).
Instant transfers have become part of everyday banking. Millions of Australians now use PayID for personal payments such as sending money to friends, sharing bills or transferring between accounts. The Reserve Bank of Australia found that around one in three Australians had used PayID for personal transfers by 2023, and adoption has continued to climb as more banks and payment apps enable real time transfers. By mid 2025, PayID registrations were estimated to have passed 27 million (Payments CMI, 2025), making it one of the most widely used ways to move money instantly between accounts.
For businesses, real time payments are also creating new opportunities. PayTo, another system under the NPP framework, enables real time debit-style payments with greater visibility and control for both merchants and customers. Analysts expect PayTo adoption to expand further through 2025 as more banks and software providers integrate it into business payment platforms (The Paypers, 2025).
Real time payments are no longer a niche feature in Australian banking. With widespread PayID use, strong account enablement across institutions and the growing reach of PayTo, they are quickly becoming the default for how individuals and businesses move money across the country.
Are Australians Changing How They Pay for E-Commerce in 2025?
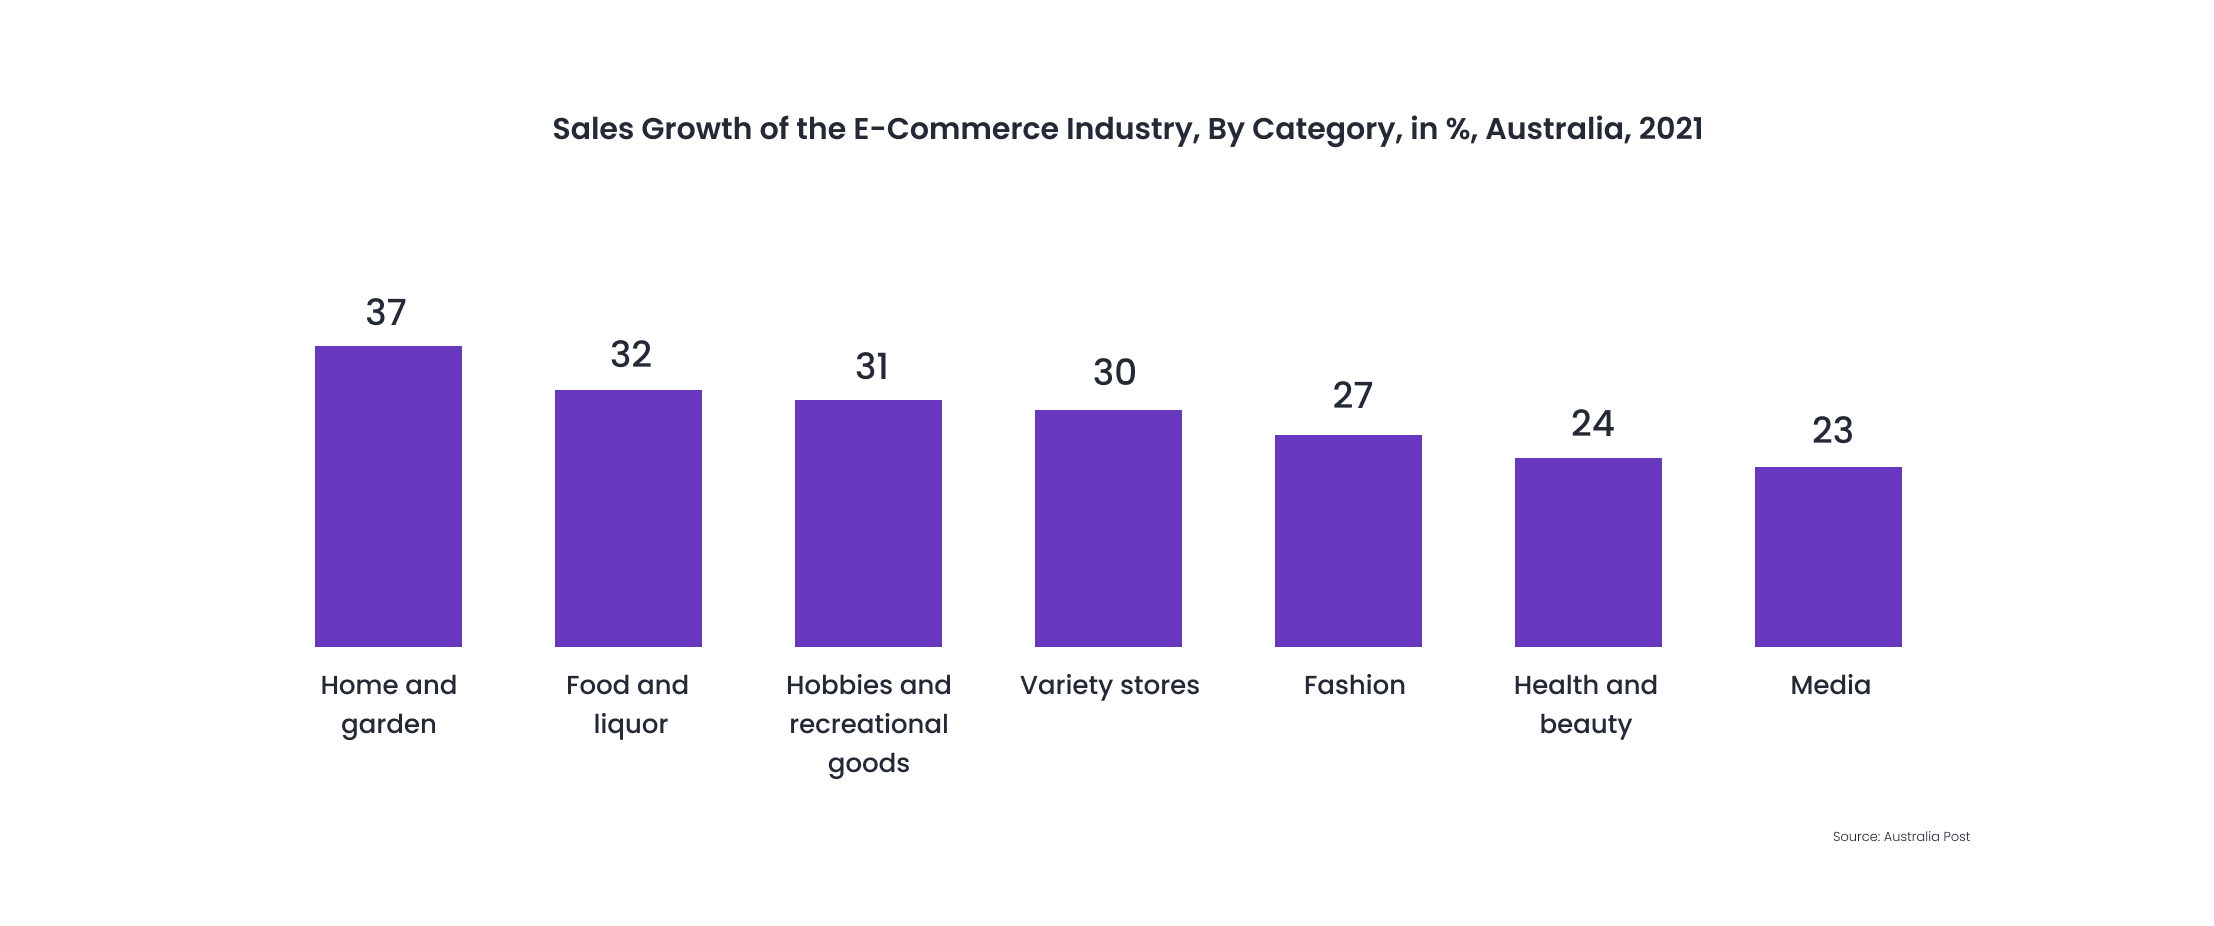
E-commerce in Australia continues to expand, with online retail sales reaching record levels through 2024. The Australian Bureau of Statistics reported that online shopping accounted for around 10 per cent of total retail turnover by late 2024, compared with about 6 per cent before the pandemic. This growth has been driven by convenience, improved delivery options and broader acceptance of online payments.
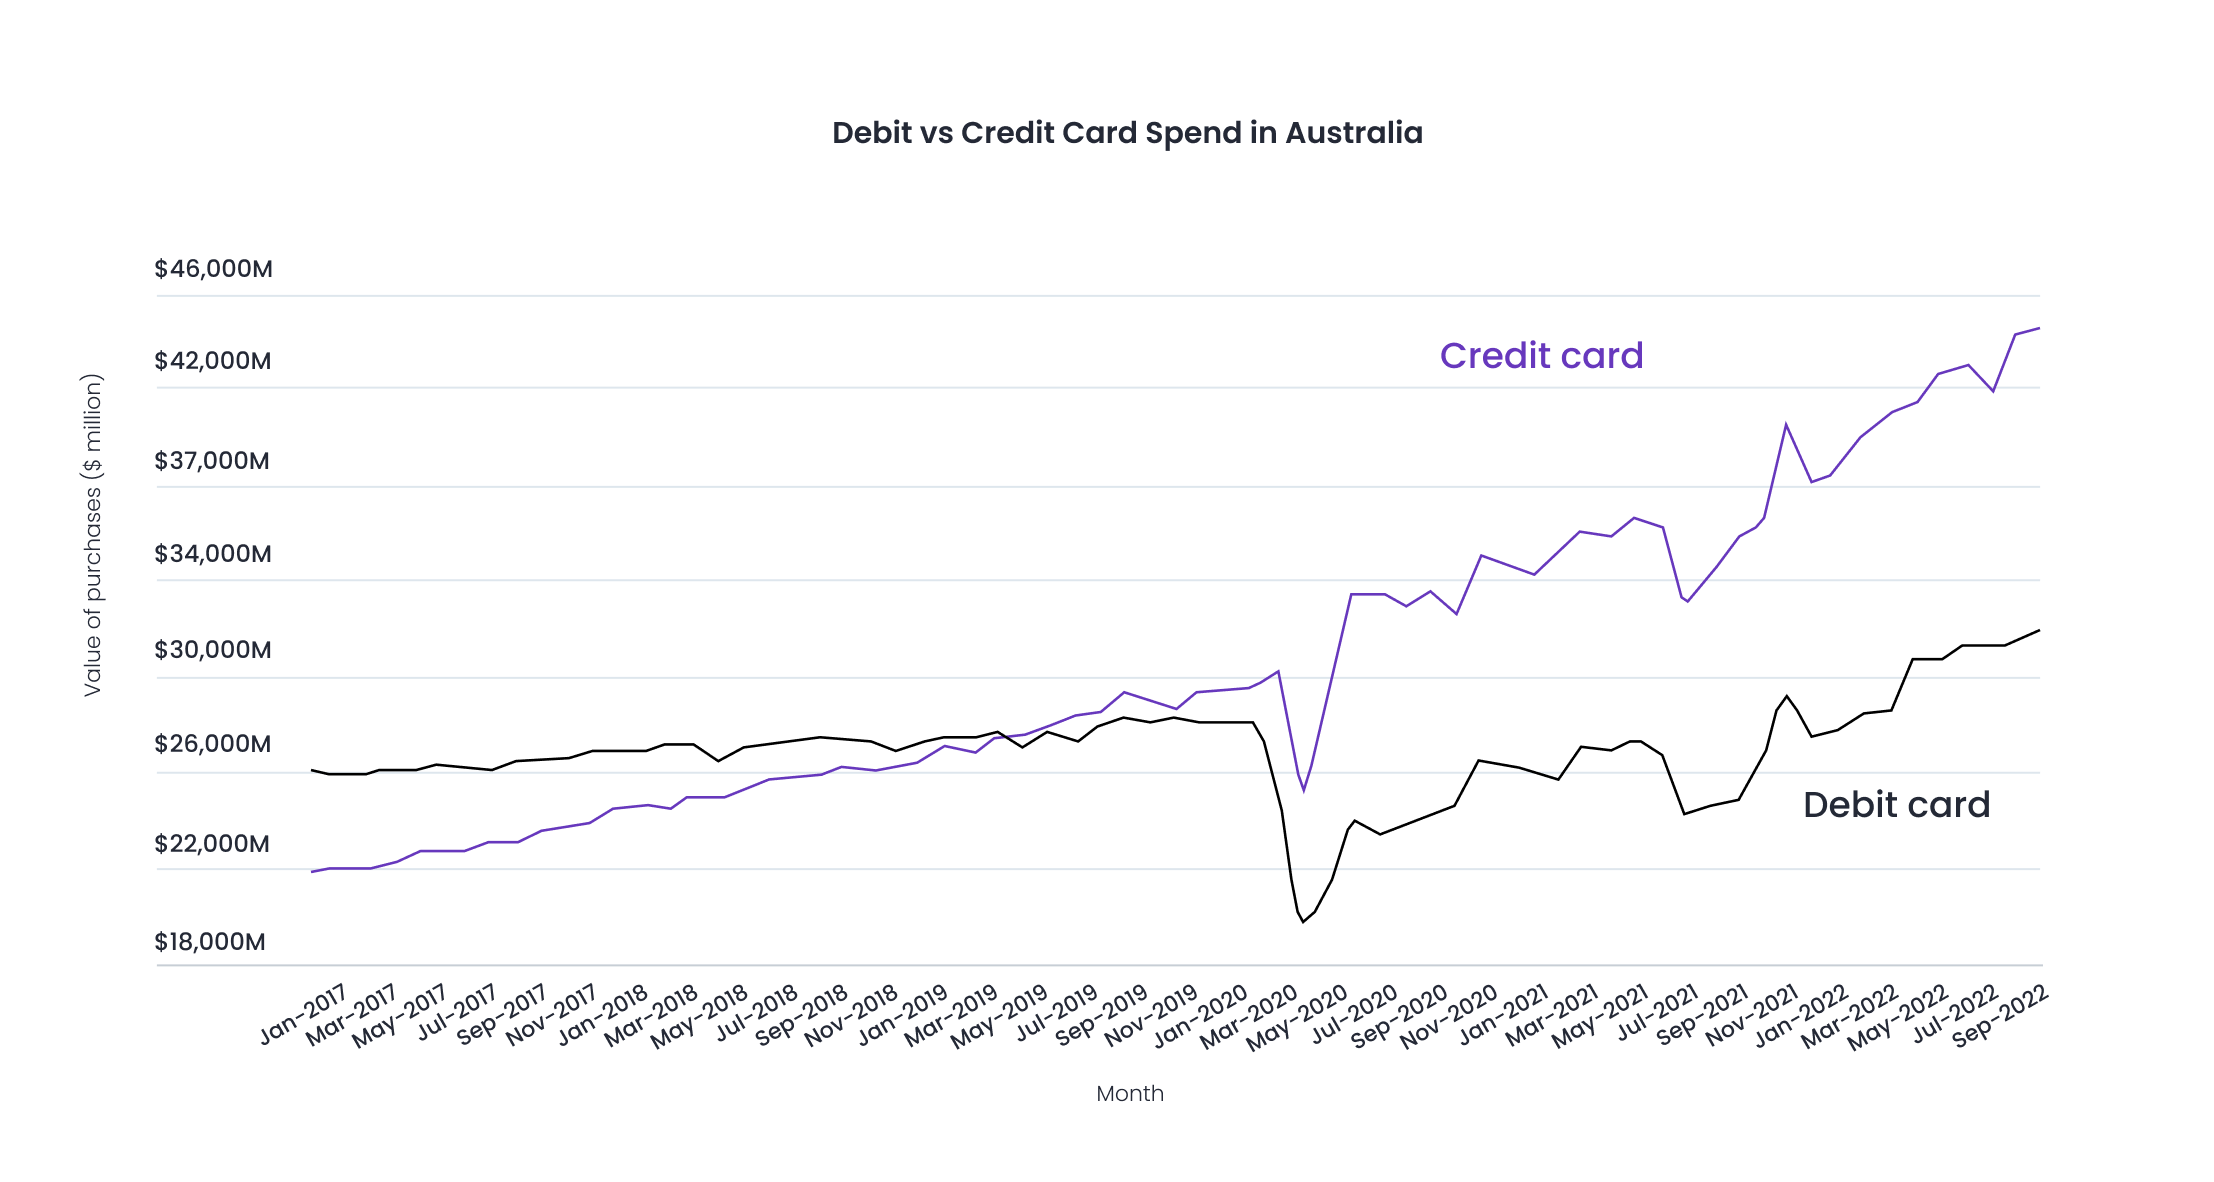
Cards remain the most common way Australians pay online, supported by widespread bank integration, security features and customer familiarity. Data from GlobalData and the Reserve Bank of Australia shows that together, debit and credit cards account for roughly two-thirds of the value of all e-commerce transactions. Their share has remained relatively stable, even as other payment types have grown.
Buy Now Pay Later (BNPL) continues to play a significant role in online spending, particularly for lower-value purchases. According to the Australian Finance Industry Association and ASIC, BNPL transaction value rose to about AUD 20 billion in 2023, with millions of Australians using the service for retail and e-commerce purchases. Following new regulation introduced in June 2025, providers must now hold an Australian Credit Licence and comply with responsible lending obligations, bringing the sector under the same framework as traditional credit.
Alternative payment options, including account-to-account transfers and PayID, are also gaining ground in online checkouts. These methods are being integrated by more merchants seeking lower fees and instant settlement compared with traditional card processing.
Overall, Australian consumers are blending convenience with familiarity when shopping online. Cards continue to lead e-commerce payments, while BNPL and real time bank transfers are shaping the next phase of online spending.
Where Is Australia Heading with Payments in 2026?
As we head into 2026, Australia’s payments landscape has clearly shifted towards digital-first options. Cards remain the backbone of both in-person and online transactions, while BNPL and real time payments through PayID and PayTo continue to gain ground. Cash use has stabilised at historically low levels, still relied upon by some older Australians and regional communities but largely replaced for everyday spending.
Regulatory reforms introduced during 2025, including BNPL licensing and proposed card fee cap adjustments, have increased competition and transparency. These changes are expected to reduce costs for merchants and improve consumer protection as digital payment systems expand.
E-commerce continues to grow steadily, supported by secure infrastructure and faster settlement systems. With widespread adoption of PayID and growing business use of PayTo, Australia is on track to become one of the most advanced digital payment markets in the world.
What’s the Future of Payments in Australia?
The next decade will bring one of the most significant changes in Australia’s payment systems. The Bulk Electronic Clearing System (BECS), which has supported direct debits and credits for decades, is being phased out. According to AusPayNet, BECS is expected to be fully retired by June 2030, subject to readiness and migration progress. New compliance changes introduced in September 2025 are already encouraging businesses to move direct debits to PayTo under the New Payments Platform (Artipi, 2025).
The Reserve Bank of Australia continues to monitor this transition to ensure system stability and security as financial institutions and businesses migrate from BECS to real time rails. As BECS is replaced, PayTo and other account-to-account systems are expected to become the main method for recurring, subscription and high-volume payments. These systems will offer faster settlement, richer transaction data and improved visibility compared with traditional batch processing.
Industry forecasts suggest that Australia’s total payments market will grow from around AUD 1.54 trillion in 2024 to almost AUD 3.96 trillion by 2034, representing an average annual growth rate of 9.9 per cent (Expert Market Research, 2025). Over the next ten years, open banking, real time infrastructure and digital identity systems are expected to converge, creating a payments environment that is faster, safer and more connected than ever before.
Together, these developments point to a future where most payments in Australia are instant, data-rich and seamlessly integrated into digital platforms used by consumers and businesses alike.
This information is correct and updated as of November 2025. This information is not to be relied on in making a decision with regard to an investment. We strongly recommend that you obtain independent financial and legal advice before making any form of investment or significant financial transaction. This article is purely for general information purposes.
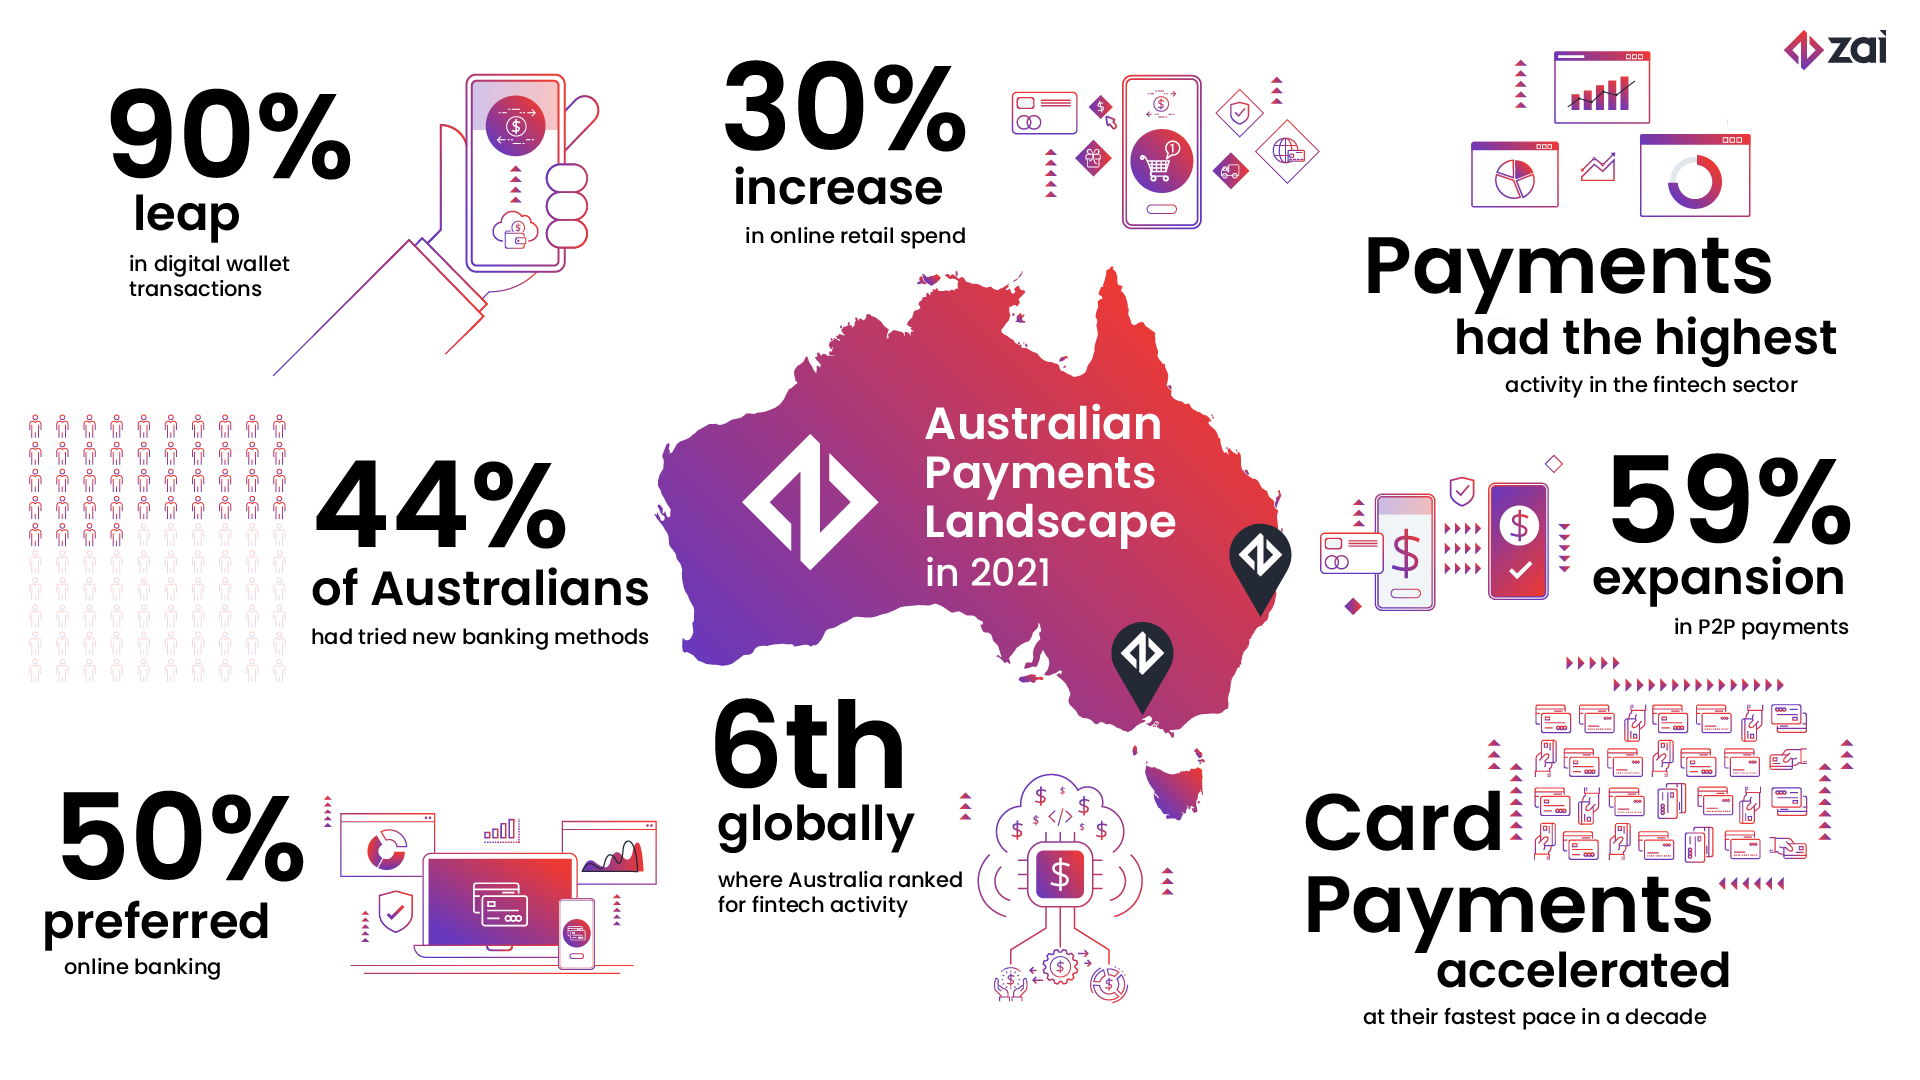
2022 Australian Payment statistics (original pre-update images)
.png?width=1500&height=819&name=Cardpayments4%20(1).png)
.png?width=1552&height=820&name=Methods%20for%20cross-border%20payments%20(businesses).png)
.png?width=1294&height=820&name=Methods%20for%20making%20cross-border%20payments%20(consumers).png)
These statistics were correct and updated as of 2022. This information is not to be relied on in making a decision with regard to an investment. We strongly recommend that you obtain independent financial and legal advice before making any form of investment or significant financial transaction. This article is purely for general information purposes.